The following guide covers:
Learning analytics is the process of collecting and analyzing data from your LMS to understand how employees engage with training, how well they progress, and what results they achieve. It helps HR and L&D teams see if learning programs are effective, where learners struggle, and how training connects to business outcomes.
You use learning analytics by regularly reviewing the data your LMS provides and connecting it to your training goals. Look at engagement to see if employees are showing up, progress metrics to understand if they are advancing, retention analytics to check if learning lasts, and ROI measures to prove business value.
Learner engagement analytics
When you look at training programs inside a company, the very first question is not whether the content is excellent or the platform has all the fancy features. The real test is whether employees are actually showing up, clicking in, and staying engaged with the learning. Engagement is the pulse of training. If the pulse is weak, no matter how good the training material is, it will not deliver results.
Why does this matter so much? Because when engagement is low, the rest of the analytics chain begins to collapse. Employees who are not logging in regularly or who abandon courses halfway through will not build new skills, will not finish the learning paths, and will not show measurable improvements in their performance.
Without keeping an eye on learner engagement, you may not even realize that employees have silently checked out.
The cost of that is twofold: first, the money spent on content development or licensing is wasted, and second, the company risks undertrained staff who cannot perform tasks up to standard.
- Login frequency
This measures how often learners log into the LMS within a given period.
It is important because it shows whether employees are actively returning to the platform or if training is treated as a one-time task. Regular logins usually indicate that training has become part of their workflow, while irregular logins are a warning sign that learners are disengaged.
- Time spent on training
Too little time may point to rushed learning, while too much time might mean the content is confusing or overwhelming. But too much time spent on learning is necessarily a great sign. That is because one of the reasons is that too much time might mean the content is confusing or overwhelming.
- Training completion rates
This measures the percentage of employees who finish the courses or learning paths they start. For corporate learning, research shows that an average completion rate for enterprise e-learning is around 20 to 30%, so anything above that indicates stronger engagement.
- Drop-off points
This identifies where learners stop or abandon a course before reaching the end. It highlights specific points in the training journey that may be boring, too complex, or poorly structured. By knowing exactly where learners lose interest, you can adjust content or format to keep them engaged.
- Self-enrollment rates
This measures how many employees voluntarily sign up for optional training courses. High self-enrollment suggests that employees see value in training opportunities.
What to do after tracking the LMS analytics?
- Encourage managers to discuss training progress in team check-ins so learners see that completing courses is valued.
- Publicly recognize teams or departments with strong completion results to reinforce learning as part of the company culture.
- Review whether mandatory courses are directly tied to career growth or compliance, and if not, reframe them as skill-building opportunities.
- When drop-offs cluster at the same module, escalate the issue for redesign and address it in learner communications.
At every point of tracking the engagement analytics, Benjamin Preston also recommends running employee surveys.
“You want to make sure that you at least start to understand what is NOT working for your employees. And the reason you do employee surveys is to understand what the pain points are for your employees. Do they feel like they are not getting enough resources? Then you are able to create an action plan to fix some of the issues”.
Benjamin Preston
Career Strategist
Learning progress analytics
Progress analytics tell you whether learners are actually building the skills the organization wants them to gain.
If you track them closely, you will know if learners are struggling with specific assessments, advancing steadily through learning paths, or reaching proficiency in the skills that matter for their roles. Without this visibility, you might assume that training is “done” once employees complete a course, when in reality, they may not have retained or applied the knowledge at all.
As for rhythm, progress analytics are best monitored at two levels. At the learner level, track weekly or monthly, depending on course length, so you can provide timely support if someone is falling behind. At the program level, review quarterly or at key checkpoints to measure whether the training strategy is actually delivering on business goals.
- Assessment scores
This measures how well learners perform on quizzes, tests, or assignments.
By tracking it, you can understand whether the knowledge has been absorbed and if the training content is at the right level.
- Attempts per assessment
This tracks how many times learners need to retake a quiz or test before passing.
It helps you see whether the assessment is too difficult, unclear, or if learners are simply guessing.
- Pass/fail rates
This measures the percentage of learners who successfully meet the required standard versus those who do not.
By looking at this, you can gauge the overall effectiveness of the training and identify if large groups of employees are struggling with the same skills. Failure rates point to misalignment between course content and learners’ existing knowledge.
- Duration to pass the test
This tracks how long it takes learners to pass an assessment, whether on the first try or after multiple attempts.
It helps you understand whether the learning process is efficient or if employees are spending too much time struggling to reach competency.
What to do after tracking the LMS analytics?
- If assessment scores are consistently low, review whether the training goals match the actual skill level of employees and consider introducing preparatory materials or mentoring.
- Partner with managers to check whether employees are given enough time and support to complete training during working hours.
- Examine whether employees are overloaded with too many courses at once, which reduces focus and retention.
- Connect training results to performance reviews and career development plans so learners see the impact of training on their growth.
- Share department-level progress trends with team leaders so they can step in early with coaching, peer support, or additional resources instead of waiting until performance problems surface.
Knowledge retention analytics
Knowledge retention analytics measure whether training actually sticks and whether employees can recall and apply information when they need it.
Without this visibility, you may think your training programs are effective simply because employees complete courses or pass tests, but in practice, the skills might not be used on the job. You might invest heavily in content creation and delivery, but without knowing if employees retain knowledge, the organization will not see real performance improvements.
- Post-training quizzes
This measures how well learners recall knowledge after completing a course, often weeks or months later. The post-training metrics are valuable as you need to compare the pre-test results to measure the retention rates.
- On-the-job application feedback
While you cannot directly measure the on-the-job application within your LMS, you can create practical assignments and use grading as a way to measure the knowledge application. Besides grading, most LMS come with gamification functionalities. Meaning that you can also award them with badges and points, and consider them when tracking the analytics.
What to do after tracking the LMS analytics?
- Integrate refresher training into performance cycles so employees regularly revisit critical knowledge rather than waiting for skills to fade.
- Link retention checkpoints to career growth so employees see that keeping knowledge fresh directly influences promotions and new opportunities.
- Set up peer-sharing sessions where employees can exchange experiences and not just stick to what was assigned for them to watch.
- Use retention analytics in workforce planning to identify areas where teams may need reinforcement before taking on new responsibilities or projects.
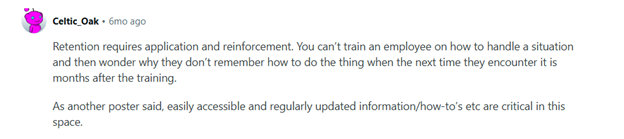
On a Reddit discussion around how to improve employee knowledge retention, one idea kept repeating. Most of the users agreed that if you want the employees to retain the training, it is better to make sure that they encounter daily work situations where they can apply the knowledge.
Otherwise, the training course becomes just another one on the list.
ROI analytics
Now, the million-dollar question you get asked a lot is probably proving that all the training you organized was worth the investment. ROI analytics are about proving that the investment pays off in measurable business outcomes. These metrics show whether training leads to better performance, higher productivity, improved employee retention, or financial returns that justify the cost.
If you can show that training contributes to improved efficiency, reduced errors, or stronger retention, you strengthen the case for continued or expanded investment in learning. ROI analytics are best tracked at broader intervals, such as quarterly or biannually, because their outcomes take time to surface.
Now, which metrics do you need to analyze?
- Pre and post-training KPIs
This compares employee or team performance indicators before training and after training.
It shows whether the skills gained translate into measurable improvements, such as faster task completion, higher quality output, or fewer errors.
- Training ROI
This measures the financial return of training by comparing the value gained from improved performance with the total cost of training.
It shows whether the program generated more value than it consumed, helping HR and leadership decide if the investment should be scaled, adjusted, or discontinued.
- Retention rates of trained employees
This tracks how long employees who received training stay with the organization compared to those who did not.
It shows whether training contributes to employee loyalty and engagement. Higher retention among trained employees signals that they see growth opportunities within the company. Statistics show that 40% of employees who receive poor training leave their jobs within the first year, showing that a lack of training leads to higher turnover.
Conclusion
LMS analytics are the evidence that tells you whether training is engaging employees, building skills, sticking in the long term, and delivering real value to the business. Without them, we would just be left with guessing whether the employee training was delivered or not.
So, track engagement metrics like logins, time spent, completion rates, and self-enrollment to see if employees are connecting with training. Monitor progress metrics such as assessment scores, attempts, pass rates, and time to pass to understand how well learners are advancing.
Check retention analytics like post-training quizzes, reinforcement activity completion, and refresher needs to ensure learning lasts. Finally, measure ROI analytics, including pre- and post-training KPIs, ROI calculations, and retention rates of trained employees to prove the business impact.
If you are looking for a platform that provides detailed analytics across all of these areas, consider Uteach. With Uteach, you can track the right metrics, make data-driven decisions, and align training with both employee growth and business goals. Book a demo with our specialist to see how Uteach can help you achieve your employee training objectives.