
The following guide covers:
Why is LMS tracking and reporting important?
Types and examples of LMS data and reports
How can you use LMS reporting data?
As our favorite fictional detective character, Sherlock Holmes, mentions, “It is a capital mistake to theorize before one has data”.
And because business is not fiction, we cannot simply play Sherlock with the training results. That is why you need to track the LMS reporting to see real evidence instead of guesswork.
With the right tracking in place, you see what works, what needs attention, and how to improve learning outcomes across the board. In this article, we will break down six key reports to pay attention to if you want to measure the effectiveness of your training, keep learners engaged, and make informed decisions that actually move the needle.
Why is LMS tracking and reporting important?
Ideas without data are just assumptions. Peter Sondergaard, global head of research at Gartner, mentions that
“Information is the oil of the 21st century, and analytics is the combustion engine.”
Your LMS reporting is exactly that engine. Sure, you can do without reporting. But you have no way of knowing how far you will go or if you are heading in the right direction. With reporting in place, the data becomes the fuel that powers better decisions and outcomes. This way, you are able to:
- Measure training effectiveness: Reporting shows you whether learners are meeting the objectives you set.
- Improve learning content and delivery: Tracking highlights which modules or sessions work well and where learners drop off.
- Monitor learner and instructor performance: Reports reveal both how learners progress and how effectively instructors engage them.
- Ensure compliance: For industries with mandatory training, reporting verifies that learners completed required courses on time. This protects organizations from compliance risks and keeps training records audit-ready.
- Support data-driven decisions: Rather than relying on gut feeling, LMS reporting gives you evidence to guide strategy.
Types and examples of LMS data and reports
Here are the reports you need to pay attention to within your LMS to be able to measure the effectiveness of your efforts and make decisions.
Learner performance
Without the learner performance insights, it is easy to miss when a learner is struggling, disengaged, or at risk of dropping out.
Tracking learner performance analytics gives you a clear picture of both individual progress and overall group or department performance. This is when you are able to easily decide when to step in with support or adjust your content.
Let’s not forget that learner performance directly impacts the effectiveness of your training. If the learners are not completing lessons, scoring poorly on assessments, or spending little time with the material, you obviously will not be able to meet your business and training objectives.
So, by analyzing these patterns, you can identify knowledge gaps, engagement issues, or even parts of your content that might need refinement.
Learner performance analytics usually include:
- Course progress and completion rates
- Quiz and test scores
- Time spent on lessons and materials
- Assignment submissions and quality
- Attendance in live sessions or coaching calls
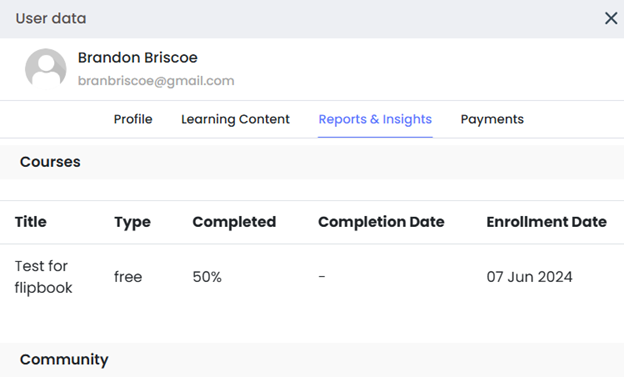
With Uteach, you can quickly see each learner’s personal profile and activity status. At a glance, you know whether they are active in any course or material, how much time they spend learning, and even the source they originally came from. This gives you context not only about their progress but also about where your learners are coming from.
The detailed reporting goes deeper. You can view exactly
- which course a learner has started,
- the date they began,
- how much of it they have completed, and their expected completion deadline.
The same applies across all of your products, whether it is a live session, a recorded video course, a coaching package, a test, a product, or a bundle. This allows you to connect the dots between different learning formats and see the full scope of a learner’s journey with your content.
Course reports
Even if individual learners are performing well, the bigger picture lies in how your courses themselves are doing. Course reports help you understand whether your content delivers the intended value and if learners are finding it engaging enough to complete.
As you can guess, these reports highlight what resonates with learners and what falls flat. Low completion rates, for example, might indicate that lessons are too long or that the course structure is overwhelming. On the other hand, high engagement in certain modules guides you to replicate those elements in other training.
Course reports usually include:
- Total enrollments per course
- Average completion rates
- Viewer drop-off points in video courses
- Content engagement by percentage
- Learner feedback and discussion activity
When you need to measure the course performance, not everything is just numbers. And if you want to use these insights to improve the training, make sure you pay attention to the qualitative data as well. For example, if you see a module with a high drop-off rate, check the learner comments or questions around that topic. Often, they point to exactly what is confusing or where attention drops.
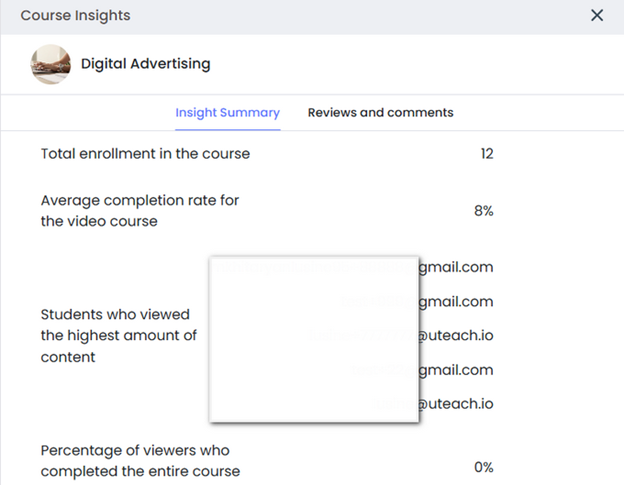
With Uteach, you can visit the course insight section for all of your courses, including live ones. Here, you immediately
- see the total enrollment numbers and the average completion rate for each video course,
- identify the students who have viewed the highest amount of content, which helps spot your most engaged learners,
- the percentage of viewers who completed the entire course, a strong indicator of how effective and engaging the course design really is.
Beyond numbers, Uteach provides a separate section dedicated to learner feedback and course discussions.
This is valuable because it tells you not only how much learners are engaging but also what they actually think about the content. Paying attention to this feedback helps you find out whether your course materials are clear, relevant, and aligned with learner expectations. The discussion threads are equally insightful, as they show recurring questions or topics where learners need additional guidance.
Quiz and assignment reports
Quiz reports help you identify knowledge gaps early. If several learners are getting the same questions wrong, it is a sign that the concept needs more explanation in your course.
But, on the other hand, consistently strong quiz results show that the difficulty level is too low and that you can raise the bar. Assignments add another layer by showing how learners apply knowledge in a practical way, which is often a better indicator of long-term retention.
Quiz reports usually include:
- Number of questions and answers submitted
- Correct and incorrect answers
- Question types and difficulty
- Status of attempts (completed, pending, failed)
- Duration of each attempt
Assignment reports usually include:
- Submission status and timeliness
- Quality of responses
- Grades
- Feedback from instructors
- Opportunities for ongoing learner-instructor communication
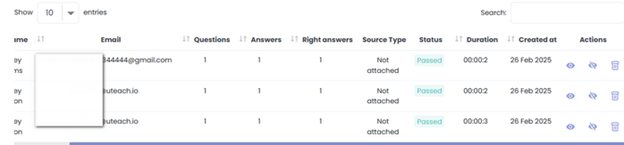
On Uteach, you get these insights at both a glance and a deeper level. For quizzes, you see the number of questions, total answers submitted, right answers, type of questions, their status, and duration. If you want more detail, you can click on a learner’s profile and view exactly which questions they answered correctly and where they made mistakes. This helps you understand both individual performance and wider patterns across your learner base.
For assignments, Uteach goes a step further. Instructors can leave direct feedback on submissions and stay in touch with learners for ongoing formative assessment. This two-way communication ensures that learners do not just receive a score but also practical guidance on how to improve, making the reporting process a tool for growth rather than just evaluation.
Certificate reports
Certificate reports are proof of achievement and motivation for learners. Tracking certificate reports helps you see who completed the requirements and how your certification programs perform overall.
Certificate reports usually include:
- Number of learners certified
- Completion dates
- Course or program tied to the certificate
- Certificate expiration information
- Need for recertification
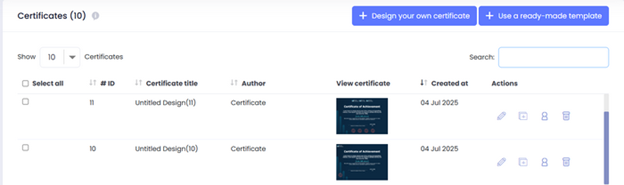
On Uteach, you can view exactly which learners have been certified for each certificate. This gives you a quick overview of who has reached the finish line and allows you to track progress across your certification programs.
Survey and feedback data
Surveys and forms give you the learner’s perspective directly. While analytics show what learners do, surveys tell you what they think and expect. They are useful for gathering insights before, during, and after a course. For example, you can ask about expectations at the start, satisfaction midway, and feedback upon completion.
You can track the reports while
- Collecting user data
- Understanding learner expectations before a course
- Collecting feedback on content clarity and delivery
- Measuring satisfaction after completion
- Gathering suggestions for improvement
- Running pulse checks on learner motivation or challenges
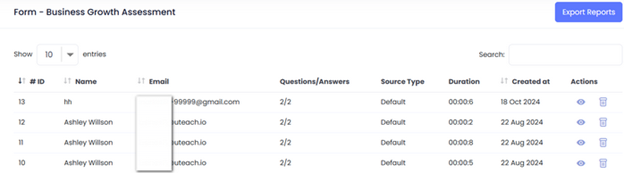
These reports matter because they reveal the “why” behind the numbers. A drop in completion rate makes sense once you see feedback about pacing or difficulty level.
With Uteach, you can view all responses in a dedicated form report. Questions and answers are clearly displayed, making it simple to analyze learner feedback at any stage.
Sales and financial data
If you are running external training programs, financial and sales data is as important as learner performance. These reports help you understand not only how much revenue your training generates but also which products or services drive that revenue.
In this regard, you can track the reports like:
- Total sales within a selected period
- Revenue per product type (courses, live sessions, coaching, digital products)
- Recently sold products
- Sales trends by week, month, or custom dates
- Repeat customer purchases
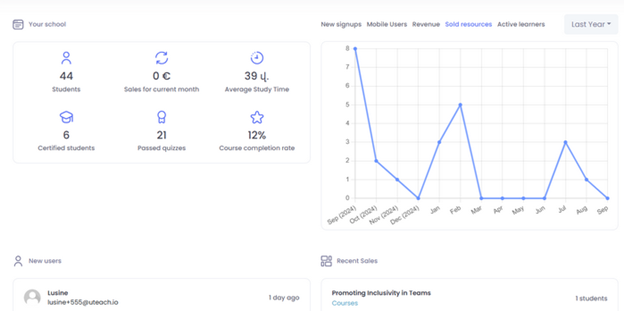
On Uteach, you can view these insights directly from your dashboard. The overview includes a sales data graph based on dates for the period you choose, such as the last 7 days, a week, or a month. Along with the graph, you also see the total amount of sales made during that timeframe.
Another report gives you a clear list of recently sold products, including courses, live sessions, coaching packages, and digital products. This makes it easy to track what is currently in demand and where most of your income comes from.
How can you use LMS reporting data?
“Data is like garbage. You’d better know what you are going to do with it before you collect it.”
Mark Twain
Now that you know what reports you need to collect, the question is how you use those reports to improve your training and align them with business goals.
As you analyze the reports, make sure you also
- Identify trends in learner behaviour
By studying patterns such as login frequency, time spent on content, or drop-off points, you can predict where learners might disengage. Recognizing these trends early helps you adapt learning experiences that keep participation high and prevent wasted investment in underused programs.
- Pinpoint gaps
Reports show where learners consistently struggle or fail assessments. This directs you to knowledge areas that require additional resources or restructured content, which strengthens workforce skills and reduces costly mistakes on the job.
- Refine strategies
Data highlights which training formats or approaches deliver better results. With these insights, you can fine-tune your L&D strategy, invest in methods that resonate with learners, and cut those that do not, ultimately saving time and money.
- Measure the effectiveness of training
Completion rates, performance scores, and feedback results give you hard evidence of whether training supports company objectives. If employees are more competent and compliant after completing courses, the business gains efficiency and reduces risks.
Key takeaways
Tracking the LMS reporting also means turning those numbers into actionable insights. From learner performance to course engagement, from quizzes and assignments to certificates, surveys, and even financial data. Together, they give you the full picture of how effective your training is and how it drives business results.
If you are looking for an LMS with detailed reporting, consider Uteach. With Uteach, you can see everything from learner progress and activity to course insights, survey feedback, certificates, and financial performance, all in one place. The platform makes reporting practical and accessible, helping you make decisions backed by data rather than assumptions.
Book a demo with our specialist today to experience the end-to-end reporting workflow from within and see how Uteach can support your training and business goals.