The following guide covers:
Your LMS dashboard's main components
How to use Uteach LMS dashboard to automate reporting?
Employee training delivery statistics
Other LMS dashboard examples and what I like about them
Leadership and management development statistics
If your training reports still start with exporting spreadsheets, checking who answered in Slack, and asking managers for updates, then your LMS dashboard is not really doing its job yet. For me, a good LMS dashboard is not just a place where you see numbers. It is rather what gives you centralized control, flexibility, and saves you time you would spend on manual actions.
That is why in this article, we will walk through the main LMS dashboard components that help teams automate reporting and make better decisions. We will discuss examples of LMS dashboards of overviews, filtering, course insights, learner progress, communities, live session tracking, AI-assisted reporting, and workflow automation with Uteach.
At the end, you can also compare it with a few other LMS dashboard examples and see the key capabilities.
What is an LMS dashboard?
An LMS dashboard is the central hub where admins can track the whole learning process without having to go through several different reports.
No matter the type of LMS, your LMS dashboard brings together the data you need to understand learner activity, course progress, quiz results, certificates, attendance, engagement, and sometimes even sales performance. So instead of only knowing that “training is running,” you can actually see how it is performing, where people are falling behind, and which parts need your attention.
Your LMS dashboard's main components
Let’s see the key reporting and insight LMS dashboards provide and discuss on specific examples,
#1 Overview of results
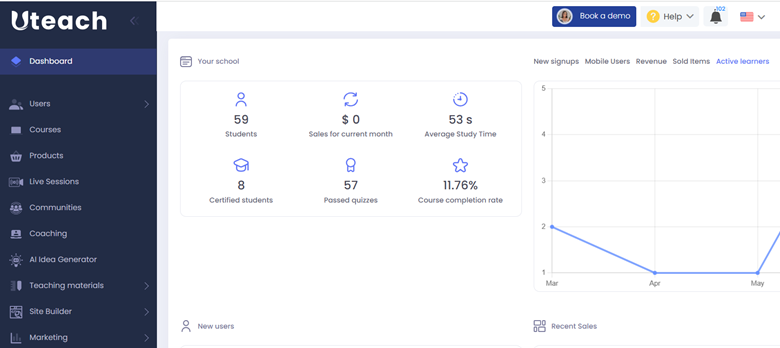
The overview panel is the first thing you usually see when you log in. And it should answer the questions that you usually report about at meetings. And the most common ones are those that help managers understand if the investment brings the results needed.
For example, with the Uteach dashboard, you can see
- Total number of learners and certified learners
- Average study time
- Passed quizzes and course completion rate
- Charts for new signups, mobile users, and active learners, which you can all filter by date range.
And in case you offer extended enterprise training, selling training to your partners and customers, you will be able to analyze the sales data as well.
#2 Filtering and data segmentation
Raw numbers are of course useful. But when you need to make actionable decisions, they barely tell you anything about where to invest next. To learn the answer to that question, you can use segmentation and filtering.
On your main dashboard, you already learned that, for example, 60% of employees completed the compliance course. But if you need to know that the operations team is at 20% while sales is at 95%, you can use Uteach’s filtering options.
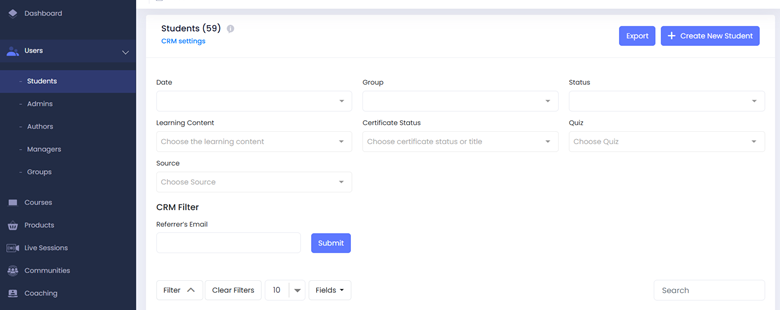
You can filter the learners' data by:
- Date to view activity within a specific period
- Group to isolate a team or department
- Status active, inactive, or other custom states
- Learning content filter by a specific course or product
- Certificate status: see who has earned a certificate and who hasn't
- Quiz filter by quiz completion or result
But most importantly, you can create your own filters. For example, if you need to filter by employee roles, just create a custom attribute in the CRM and reapply the filters. So, if you just wanted to analyze which employee from the retail division did not receive their compliance certificate yet, you can see in seconds.
#3 Course insights
What I think is the elephant in the room for most teams is whether the training programs are effective at all. If you want to only invest in content that is working, the course insights are what your team needs.
In the case of Uteach, the course insights dashboard shows an overview of:
- Total enrollment in the course
- Average completion rate for the video course
- Which students viewed the highest amount of content
- Percentage of viewers who completed the entire course
If the completion rate is too low (which is below 20% according to the recent research by Zahan), that is one of the signals for poor engagement and learning experience. If you want to know when and whether you should update your training content, check out our guide on how to update the training content.
And if you still cannot figure out the reason behind low completion, the best way would be to use surveys to ask employees. Uteach has a dedicated survey builder, so you do not need to use or connect extra tools.
Once the employees fill in the form, you will be able to see their answers in the reports.

#4 Learner progress
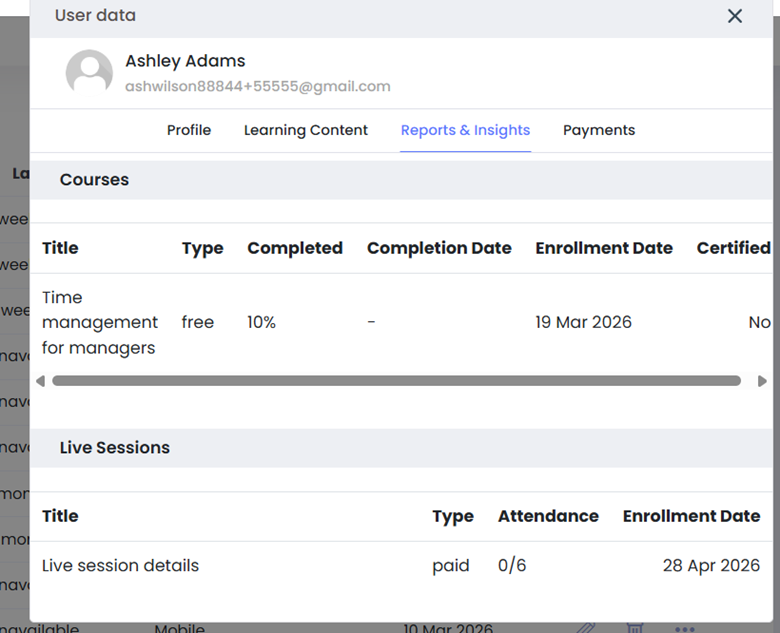
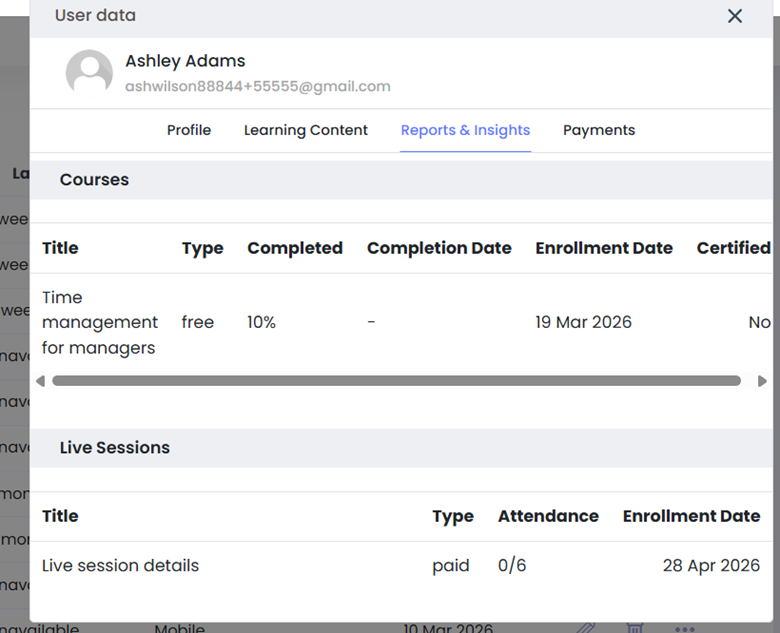
An LMS dashboard shall also provide you with analytics for each learner, not only the groups and departments. With Uteach's individual learner panel, which you access from the learners list, gives you a complete picture of one person's learning journey. Under the Learning Content tab, you can see:
- Every training they are enrolled in, with the enrollment date and type
- Their current completion percentage for each course
- Completion date (if finished) and certification status
- Digital downloads that they enrolled in
In the reports, you get quiz-level data: scores, right and wrong answers, attempt status, and duration. So if you notice that they are staying behind from where they were supposed to be, you can reach out to each employee directly.
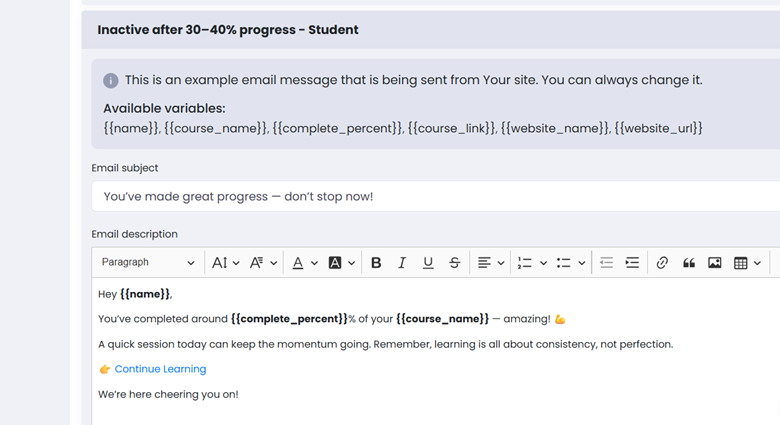
With that in mind, there is absolutely no need to keep an eye on the employee's progress and remind them that they have deadlines. From your LMS dashboard, you can automate the emails and notifications based on scenarios.
For example, suppose an employee forgot they had training to complete, and they completed only 30%. The system would send them an email to remind. Uteach offers email templates for different cases, and you can customize the email message.
#5 Communities
Learners who ask questions, share challenges, and discuss what they are applying in work are more likely to retain what they learned. And why not, more likely to finish the training in the first place. From your Uteach dashboard, you can create training-linked communities, so learners can have a single Slack channel rather than having a separate one, so the employees remain in a distraction-free environment.
- Who can join the community (open or group-restricted)
- Who can post and create Topics
You can create a separate community for each course or team group, attach it directly to the learning content, and keep all discussion trackable in one place.
From a reporting perspective, the community is a qualitative signal. If a course has an engaged, active community around it, that tells you something about learner investment.
#6 Live session automation
Live sessions are often the hardest part of training to track. You need to know who attended which session. Who's at 1 out of 7 and at risk of falling behind on mandatory attendance?
Your LMS dashboard with Uteach has a dedicated attendance tracking. You can see a grid view of every learner mapped against every scheduled session date, with a checkmark for attended and a total attendance ratio․
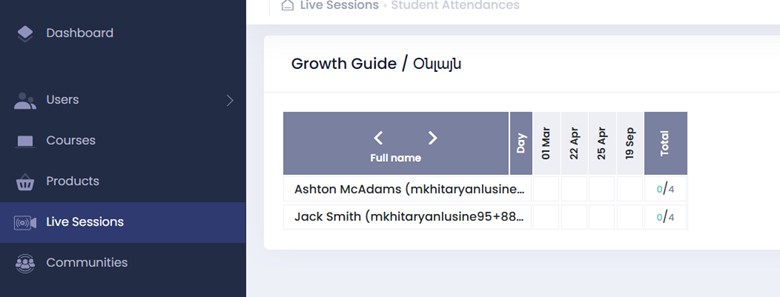
As for the employees, they each automatically get their own calendar for training. That way, they can see when they have live training due that month and not only.
How to use Uteach LMS dashboard to automate reporting?
What I find really practical about LMS dashboards is that you do not have to do the heavy lifting yourself. Uteach has a built-in AI assistant that can pull specific data from your platform on demand, generate content for you, and save you the kind of manual work that eats up your time.
A few examples of what you can ask it in the middle of your workday:
- "Create a multiple-choice quiz on workplace safety procedures with 10 questions" — and it generates one, ready to attach to a course
- "Which employees haven't completed the Annual Compliance course and don't have a certificate yet?" — it pulls that data without you digging through filters
- "Who are the most active learners on the platform this month?" — ranked list, instantly
- "Which team members enrolled in the Customer Service Fundamentals course but haven't started?" — so you can follow up before the deadline
- "Give me a summary of quiz performance for the Q2 onboarding cohort"
In the example below, I asked the assistant to provide me with the data on the courses that have higher completion rates.
That makes a difference between working in your dashboard and having your dashboard work for you.
But you can take it even a step further, and automate more of your tasks using Claude cowork, Make, Zapier, n8n, or any other tool your team uses.
Uteach provides a full API, which means your team can build any workflow automation needed.
For example,
- Send a Slack message to a manager the moment their team member completes a certification (automating notifications and emails that managers get is also accessible through the Uteach dashboard)
- Create a weekly Google Sheets report of all learners who are below 50% completion on required courses, etc.
Also check: LMS Workflow Automation | 8 Processes To Stop Doing Manually
Other LMS dashboard examples and what I like about them
360 Learning
360Learning is an LMS for everyone who values the collaborative learning approach, and the admin dashboard is built around that experience, too. What I like about it is that the engagement analytics do not just show who completed what, but also how exactly the employees interact with the content.
The reviewers on G2 especially highlight that it’s easy to manage and intuitive for the admins and the learners. Another thing they find useful is the logic behind the paths and modules, which is suitable for the flexibility in content delivery.
Docebo
Docebo has invested heavily in customizable dashboards. The recent reviews on G2 about Docebo all highlight the admin interface and the admin dashboard being easy to follow and straightforward. The reviewers especially like the capability of being able to customize the pages for different learning personas.
What I like about this LMS dashboard is that managing the learning catalogs and content types is flexible, so the learners receive training based on their training needs. What I find truly practical about the Docebo dashboard is that you can fully customize it in the sense that you have a custom dashboard.
Meaning, if specific metrics, analytics, and results are a priority for you, you can select the widgets and apply filters, so the more important filters are available at a glance.
iSpring LMS
iSpring's Supervisor Dashboard is what I call a manager-first design. Managers get direct visibility into their team's progress and results. Reporting covers progress, deadlines, certification status, and knowledge gaps, with export options in CSV, Excel, and PDF.
As for the G2 reviewers, they appreciate the simplicity and how quickly teams get up and running. What most reviewers do not like is that reporting flexibility is limited for users who want to build custom multi-variable reports.
Like with Docebo, iSping also supports customizing your own dashboard. However, the customization is only possible through code, as you are able to use custom CSS to adjust the layouts and everything.
You can check the review of 7 other LMS for employee training and compare.
FAQ
- What should I look for in an LMS dashboard as an admin?
The first thing I would check is the filtering depth. You should be able to filter reports by date, group, department, course, learner status, certificate status, quiz results, and other fields that matter to your team. Because “70% completion” sounds good until you realize one department is at 95% and another is at 20%.
The second thing is individual learner visibility. Group reports are helpful for meetings, but when someone is falling behind, you need to open one learner’s profile and see the full picture: what they are enrolled in, how much they completed, which quizzes they passed or failed, whether they received a certificate, and where they stopped.
Customizability is also important. Every company tracks training differently. One team may care about compliance certificates, another may care about partner training completion, and another may need reports by role, region, branch, or onboarding cohort. So, the dashboard should let you adjust the data around your own structure.
Also, in many cases, you still need to send a report to managers, HR, leadership, or clients. So being able to export the data to Excel, CSV, or another reporting format makes the dashboard much more useful in real work.
- Can I export data from the Uteach dashboard?
Yes, you can export data from the Uteach dashboard.
This is useful when you need to send reports to managers, compare results outside the LMS, keep records for compliance, or build a more customized report for leadership. Exporting helps you turn dashboard data into something easy to share, archive, or present.
- Can ChatGPT create a dashboard?
Yes, but with one important difference.
ChatGPT can help you create a dashboard structure, analyze your exported LMS data, suggest what metrics to include, generate charts, and even help you build dashboard layouts or formulas. For example, if you export learner progress data from your LMS, you can ask ChatGPT to show completion trends, compare departments, find learners below a certain progress level, or summarize quiz performance.
But ChatGPT is not an LMS dashboard by itself. It does not automatically track your learners inside your LMS unless you connect it to data through exports, spreadsheets, API workflows, or other automation tools.
So I would say ChatGPT is useful as an extra analysis layer.
Ready to see Uteach's dashboard in action? Join the organizations that have reduced administrative workload by 70% and scaled their training programs without scaling their admin headcount. Book your demo with the Uteach team to learn how we can help your team grow.